Real-time graph of the temperature (probe PT100)
Page 1 of 1

Real-time graph of the temperature (probe PT100)
![]() Alessandro Thu Nov 12, 2009 7:45 pm
Alessandro Thu Nov 12, 2009 7:45 pm
The thermometer was inserted into the channels 43 and 44 of the card.
Then I connected the thermometer well in the channels 45 and 46 of the card, simulating the presence of two probes PT100.
The web interface of the multimeter gives us the opportunity to monitor real time the temperature of the thermometer.
In this case, the thermometers are two.
Setting the scan:
- Scan Count = 100
- TIME: Subsequent Triggers Every = 5 sec
Real-time graph:
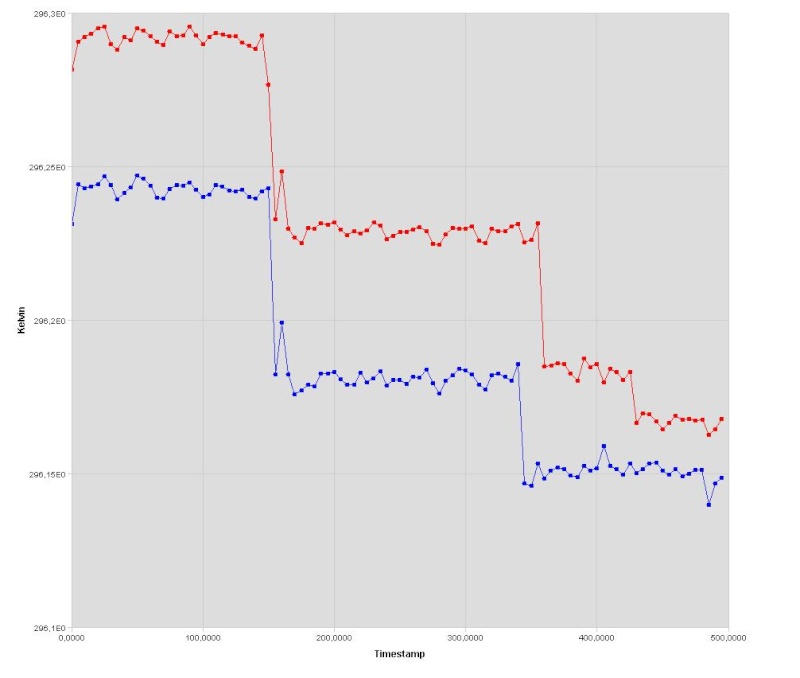
Channel 43 is blue, 44 red.
Between the two channels is a voltage drop due to resistance of the wires to connect.
Real-time graph of the voltage between the two probes, channels 45 and 46:
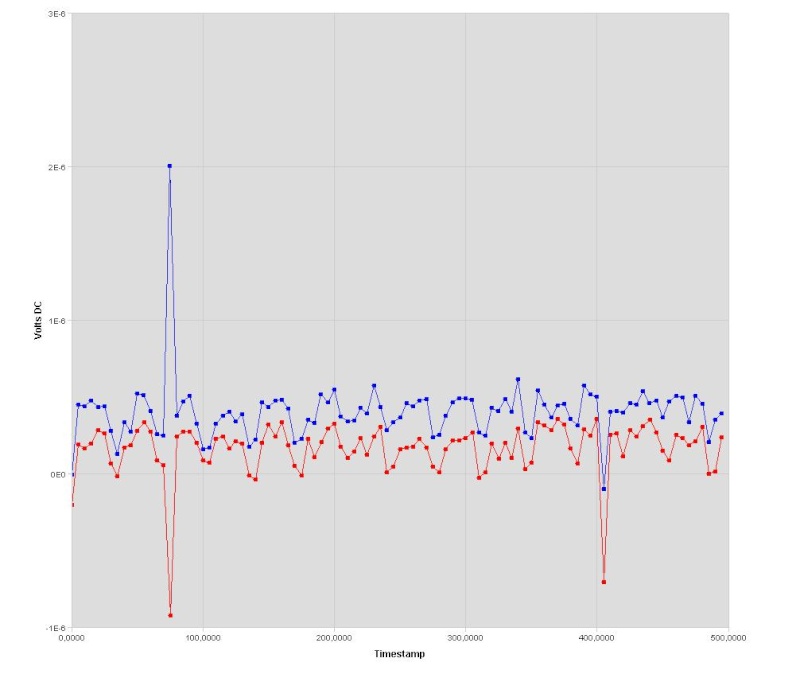
The temperature trend is not perfect because of a ambient slightly ventilated.
The test was repeated without the hassle of wind, with the following results:
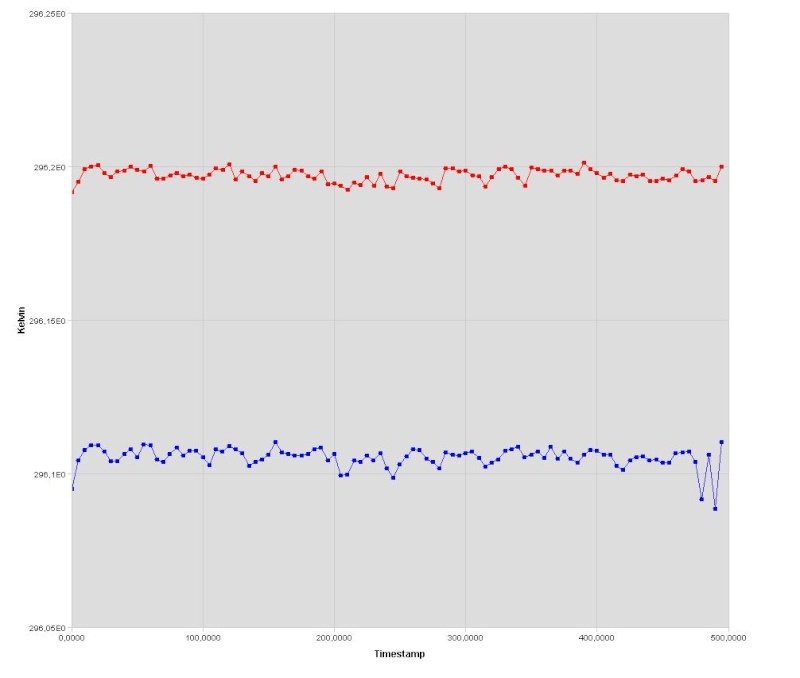
with two thermometers real this difference would be eliminated.
Useful Applications:
We can see the evolution of all probes simultaneously, or select a limited number of probes.
Problems:
The data file saved is difficult to develop with external software.
Then I connected the thermometer well in the channels 45 and 46 of the card, simulating the presence of two probes PT100.
The web interface of the multimeter gives us the opportunity to monitor real time the temperature of the thermometer.
In this case, the thermometers are two.
Setting the scan:
- Scan Count = 100
- TIME: Subsequent Triggers Every = 5 sec
Real-time graph:
Channel 43 is blue, 44 red.
Between the two channels is a voltage drop due to resistance of the wires to connect.
Real-time graph of the voltage between the two probes, channels 45 and 46:
The temperature trend is not perfect because of a ambient slightly ventilated.
The test was repeated without the hassle of wind, with the following results:
with two thermometers real this difference would be eliminated.
Useful Applications:
We can see the evolution of all probes simultaneously, or select a limited number of probes.
Problems:
The data file saved is difficult to develop with external software.

Alessandro- Posts : 42
Join date : 2008-12-11
Location : Roma
» Test real-time data acquisition with DT470-SD
» Measure/Scan with thermometer PT100 and Multiplexer
» New Gaussian Fit on the temperature curve due to the YAG laser
» Scheme of reading to 4-wire for thermometer (PT100) - Application and Features
» Temperature sensors problem
» Measure/Scan with thermometer PT100 and Multiplexer
» New Gaussian Fit on the temperature curve due to the YAG laser
» Scheme of reading to 4-wire for thermometer (PT100) - Application and Features
» Temperature sensors problem
Page 1 of 1
Permissions in this forum:
You cannot reply to topics in this forum|
|
|