Experimental Test - Checking on the use of shielding for the cable and calculation of Sigma (S)
Page 1 of 1

Experimental Test - Checking on the use of shielding for the cable and calculation of Sigma (S)
![]() Alessandro Mon Jan 25, 2010 2:16 pm
Alessandro Mon Jan 25, 2010 2:16 pm
Data acquisition
We acquired data in time intervals of: 1 hours, and 30 minutes
The shield is equal to the mass of the cable.
The cable length is approximately 2 m.
Scan:
Measurements were made every 0.5 s (this applies to every step)
Sequence steps:
I - 1 hours (without shielding)
II - 1 hours (with shielding)
III - 30 minutes (with shielding) - (Data taken from step II - Last 30 minutes)
IV - 30 minutes (without shielding)
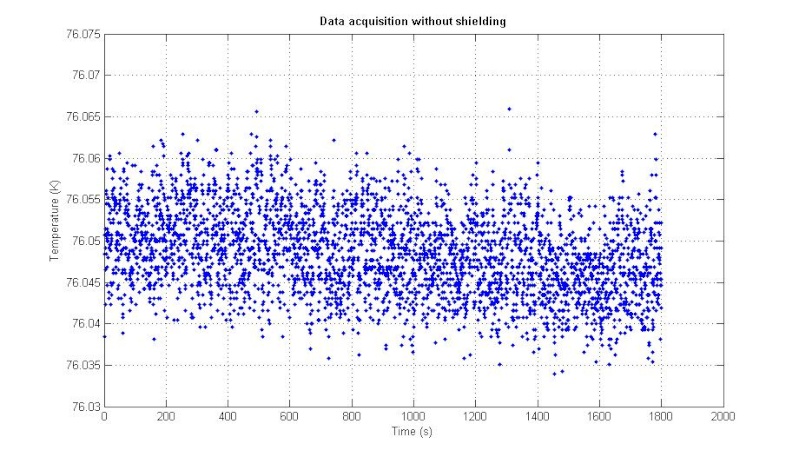
Step I (without shielding):
Data Acquisition:

Histograms with bin = 0.0035:
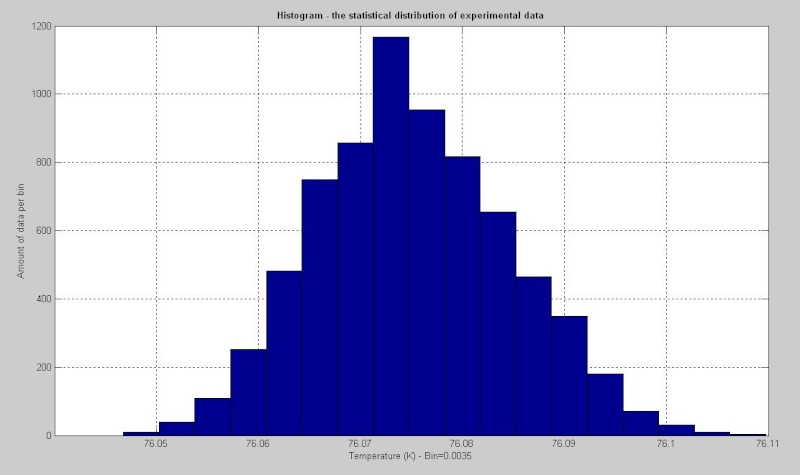
Gaussian Fit:
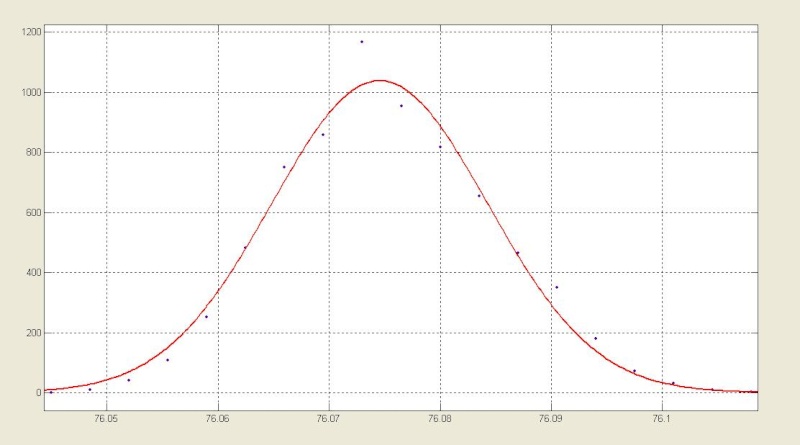
Result S: S=0.01
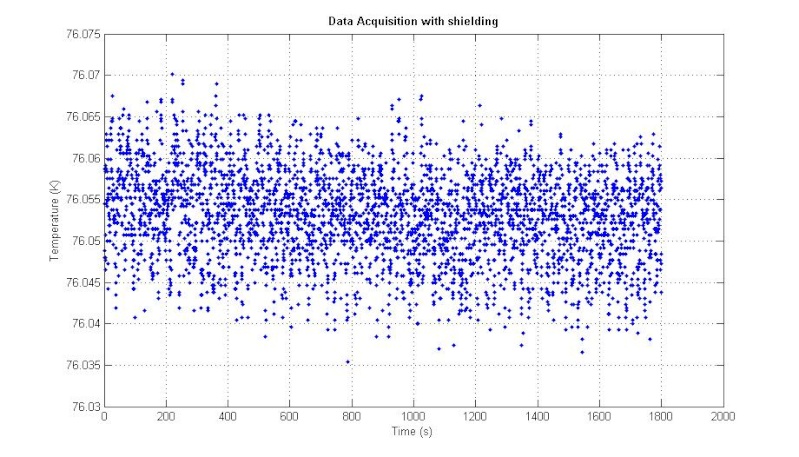
Step II (with shielding):
Data Acquisition:

Histograms with bin = 0.0035:
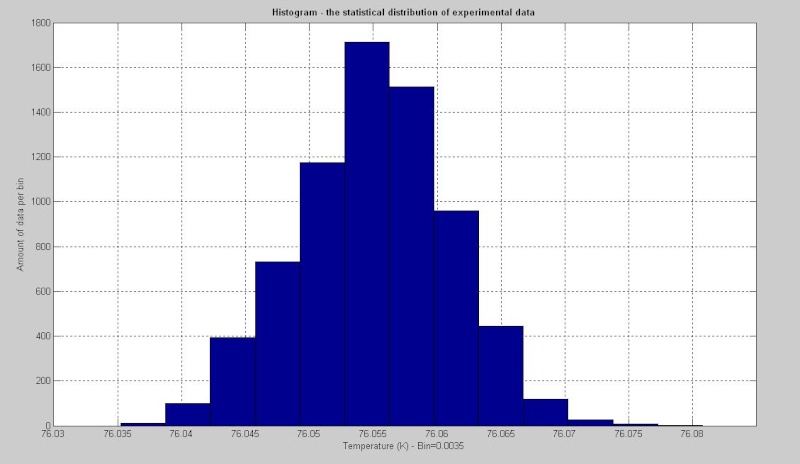
Gaussian Fit:
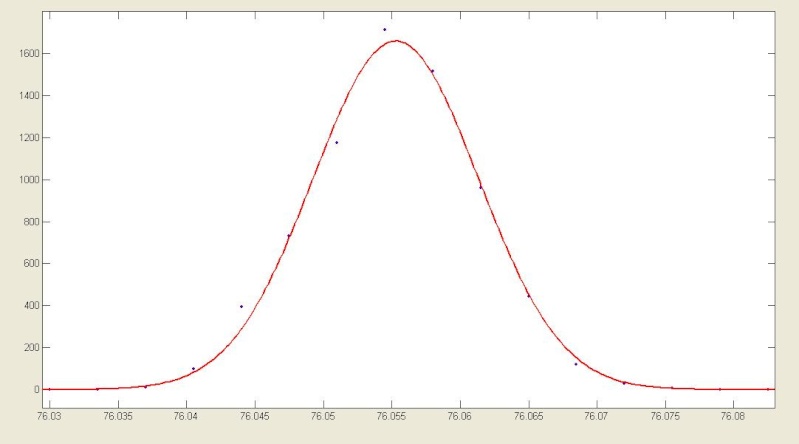
Result S: S=0.006
Step III (with shielding):
Data Acquisition:
Histograms with bin = 0.0035:

Gaussian Fit:

Result S: S=0.006
Step IV (without shielding):
Data Acquisition:
Histograms with bin = 0.0035:

Gaussian Fit:

Result S: S=0.005
Conclusions:
We acquired data in time intervals of: 1 hours, and 30 minutes
The shield is equal to the mass of the cable.
The cable length is approximately 2 m.
Scan:
Measurements were made every 0.5 s (this applies to every step)
Sequence steps:
I - 1 hours (without shielding)
II - 1 hours (with shielding)
III - 30 minutes (with shielding) - (Data taken from step II - Last 30 minutes)
IV - 30 minutes (without shielding)
Step I (without shielding):
Data Acquisition:
Histograms with bin = 0.0035:
Gaussian Fit:
Result S: S=0.01
Step II (with shielding):
Data Acquisition:
Histograms with bin = 0.0035:
Gaussian Fit:
Result S: S=0.006
Step III (with shielding):
Data Acquisition:
Histograms with bin = 0.0035:
Gaussian Fit:
Result S: S=0.006
Step IV (without shielding):
Data Acquisition:
Histograms with bin = 0.0035:
Gaussian Fit:
Result S: S=0.005
Conclusions:
- The steps III and IV shows that the shielding is not necessary, S is about the same.
- On average, the S is about 0.006 that we consider good.
- In step I, the S is larger, this is due to the thermometer; requires a time interval of stabilization.

Alessandro- Posts : 42
Join date : 2008-12-11
Location : Roma
» Test - measure of low temperature
» Power Stabilization: Calculation and Outiline
» Radiative cooling system with three rings cold directed
» Quick test
» Test real-time data acquisition with DT470-SD
» Power Stabilization: Calculation and Outiline
» Radiative cooling system with three rings cold directed
» Quick test
» Test real-time data acquisition with DT470-SD
Page 1 of 1
Permissions in this forum:
You cannot reply to topics in this forum|
|
|